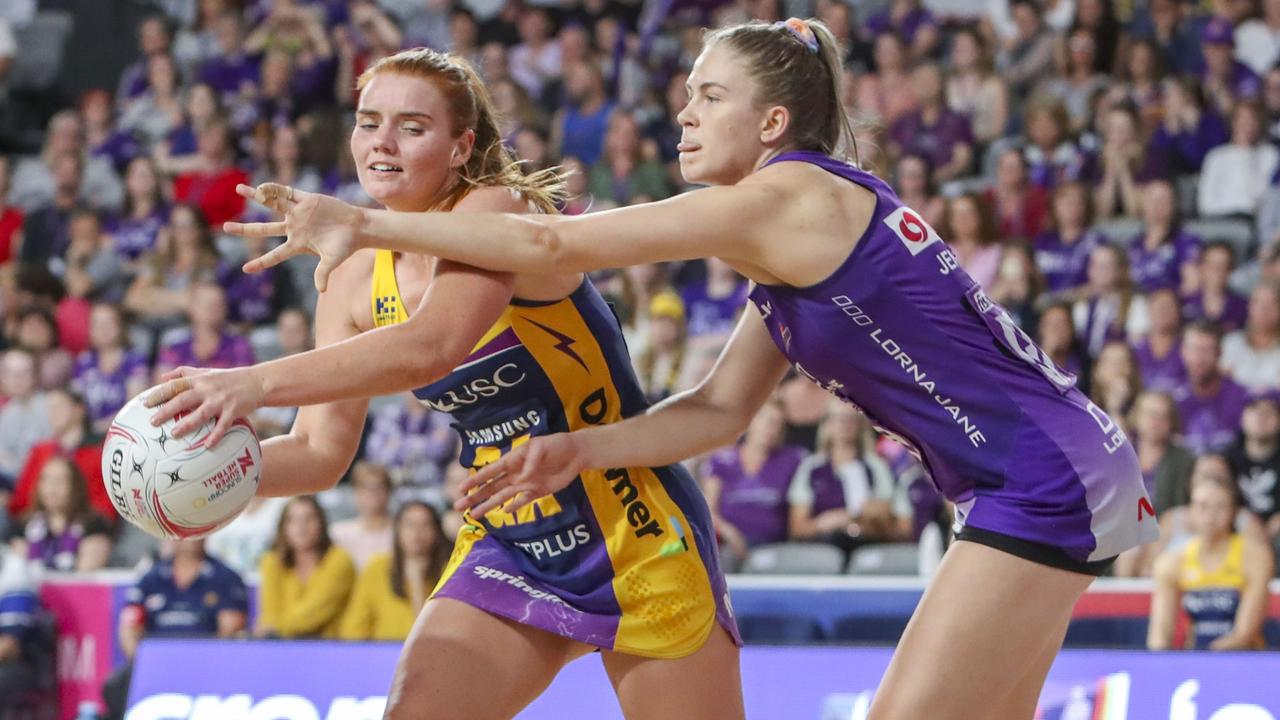
THE two Queensland derbies in the Suncorp Super Netball this season, also known as the ‘Battle of the Bruce’, produced two very different results.
Back in Round 2, it was Queensland who got the emphatic win 82 to 54, then last weekend it was the Sunshine Coast who got the win 82 to 61.
That is quite the turnaround, but what led to the turnaround from the Lightning? Let us look at the stats to see what may be the cause.
The squads
Well if there is one cause that can be pretty easily ruled out, it is who was in the squads.
Both game day squads were essentially the same in both Round 2 and Round 11, with only one change per squad.
However, the Lightning’s change was a pretty big one.
Back in Round 2, Steph Wood was ruled out with Covid so could not play, but did play in Round 11.
In saying that, she is only one player and she cannot win a match by herself, despite being the Lightning’s leading super shot shooter this year.
The team with the more mistakes lost
It may sound obvious, but there is a correlation between the penalty and turnover number and which team emerged victorious in both games.
In both Rounds 2 and 11, the team with the higher penalties and turnovers went on to lose the game.
In Round 2, the Lightning had 59 penalties and 30 turnovers, compared to the Firebirds’ 36 penalties and 15 turnovers.
Fast forward to Round 11, and the Firebirds recorded 71 penalties and 29 turnovers, compared to the Lightning’s 44 penalties and 20 turnovers.
The shooting percentages tell an interesting story
Although there was a vast change in the number of overall goals, both one point and two point goals, scored by both sides in the two games, the actual percentages do not always tell the same story.
Back in Round 2, the Firebirds shot 70 one point goals from 77 attempts, which gave them a shooting percentage of 91%. Flash forward to Round 11, and although they only shot 45 goals, they only had 50 attempts so their shooting percentage dropped to only 90%.
Moving across to the super shots, and they converted six out of their 10 attempts back in Round 2 for a percentage of 60%. In Round 11, they did shoot more super shots, eight to be exact, but they also had more attempts so their percentage dropped to 57%.
The Sunshine Coast’s tale is a very different story.
Back in Round 2, they converted 48 of their 55 one point attempts for a percentage of 87%. In Round 11 though, they had a higher number of one point goals (68), their shooting percentage was still 87%.
Moving across to the super shot percentages, and there is a vast change.
Back in Round 2, the Lightning only converted a quarter of their super shot attempts. In Round 11, even though they had three less attempts then they did in Round 2, they converted a much higher percentage of those nine attempts (77%).


Games of the Weekend | April 26-29
ANZ PREMIERSHIP MATCH OF THE ROUND Northern Mystics vs Mainland TactixMonday at 7:30pmThe Trusts Arena, Auckland The weekend’s ANZ Premiership action concludes with a top of the table epic. The Tactix and Mystics are off to a strong start to begin this season, but one of their undefeated starts will come to an end on […]

RECAP | SSN – Round 2 2024
IN the match of the round in the Suncorp Super Netball, the Melbourne Vixens escaped with a narrow win over the Adelaide Thunderbirds to keep their undefeated record in tact. It was a close match all night but the Vixens pulled away in the dying stages to take the win. After a wayward pass from […]

Games of the Weekend | April 19-22
ON the menu in World Netball this week includes an English top four match up, a much anticipated match up between former team mates in Australia, and an intriguing clash in New Zealand. ANZ PREMIERSHIP MATCH OF THE ROUNDCentral Pulse vs WBOP MagicSaturday at 4pmTSB Arena, Wellington The first fixture of the entire ANZ Premiership […]

RECAP | SSN – Round 1 2024
THE Sunshine Coast Lightning have made a statement in their opening game of the SSN season, downing the NSW Swifts by 16 goals. The Lightning caught the Swifts on the hop in crucial situations, and despite a strong Super Shot game from the Swifts it was not enough to make a difference. It was tight, […]

Eleanor’s excited about history-making Mavericks
TODAY marks the start of a new era in the Suncorp Super Netball, with the Melbourne Mavericks making their official competition debut later today. One of the team’s biggest stars Eleanor Cardwell has enjoyed every part of the process leading up to today’s game. “It’s been great,” Cardwell said. “I’ve been here since the start […]

GAMES OF THE WEEKEND | April 12 to 14 2024
FOR the first time in 2024, all three of the world’s biggest netball leagues are up and running, so we are going to take a look at some of the key matches around the world this weekend. ANZ PREMIERSHIP MATCH OF THE ROUND Northern Stars vs. Central PulseSunday at 4pmPulman Arena, Auckland Although it is […]

PREVIEW | 2024 Suncorp Super Netball
AFTER an action packed off season, Suncorp Super Netball is back this weekend. Thanks to one of the most chaotic re-signing periods in recent memory, this SSN season is less predictable than ever before. Although some sides have been more affected than others, no team’s list is 100% the same as their 2023 squad. With […]

RECAP | SSN 2024 Team Girls Cup Day 3 wrap
ONE last day of the Team Girls Cup saw the NSW Swifts crowned as tournament champions after defeating the Melbourne Vixens in the final, while the GIANTS, Lightning and Thunderbirds also picked up wins. GIANTS Netball vs Melbourne Mavericks GIANTS 11 | 7 | 10 | 12 (49)Mavericks 8 | 6 | 12 | 10 (36) […]

RECAP | SSN 2024 Team Girls Cup Day 2 wrap
DAY 2 at the Team Girls Cup went to another level after a strong day one, with eight matches taking place across two sessions. MORNING SESSION Adelaide Thunderbirds vs Sunshine Coast Lightning Thunderbirds 9 | 12 | 7 | 10 (38)Lightning 11 | 7 | 9 | 10 (37) Thunderbirds: Romelda Aiken-George (18/20 goals), Tayla […]
