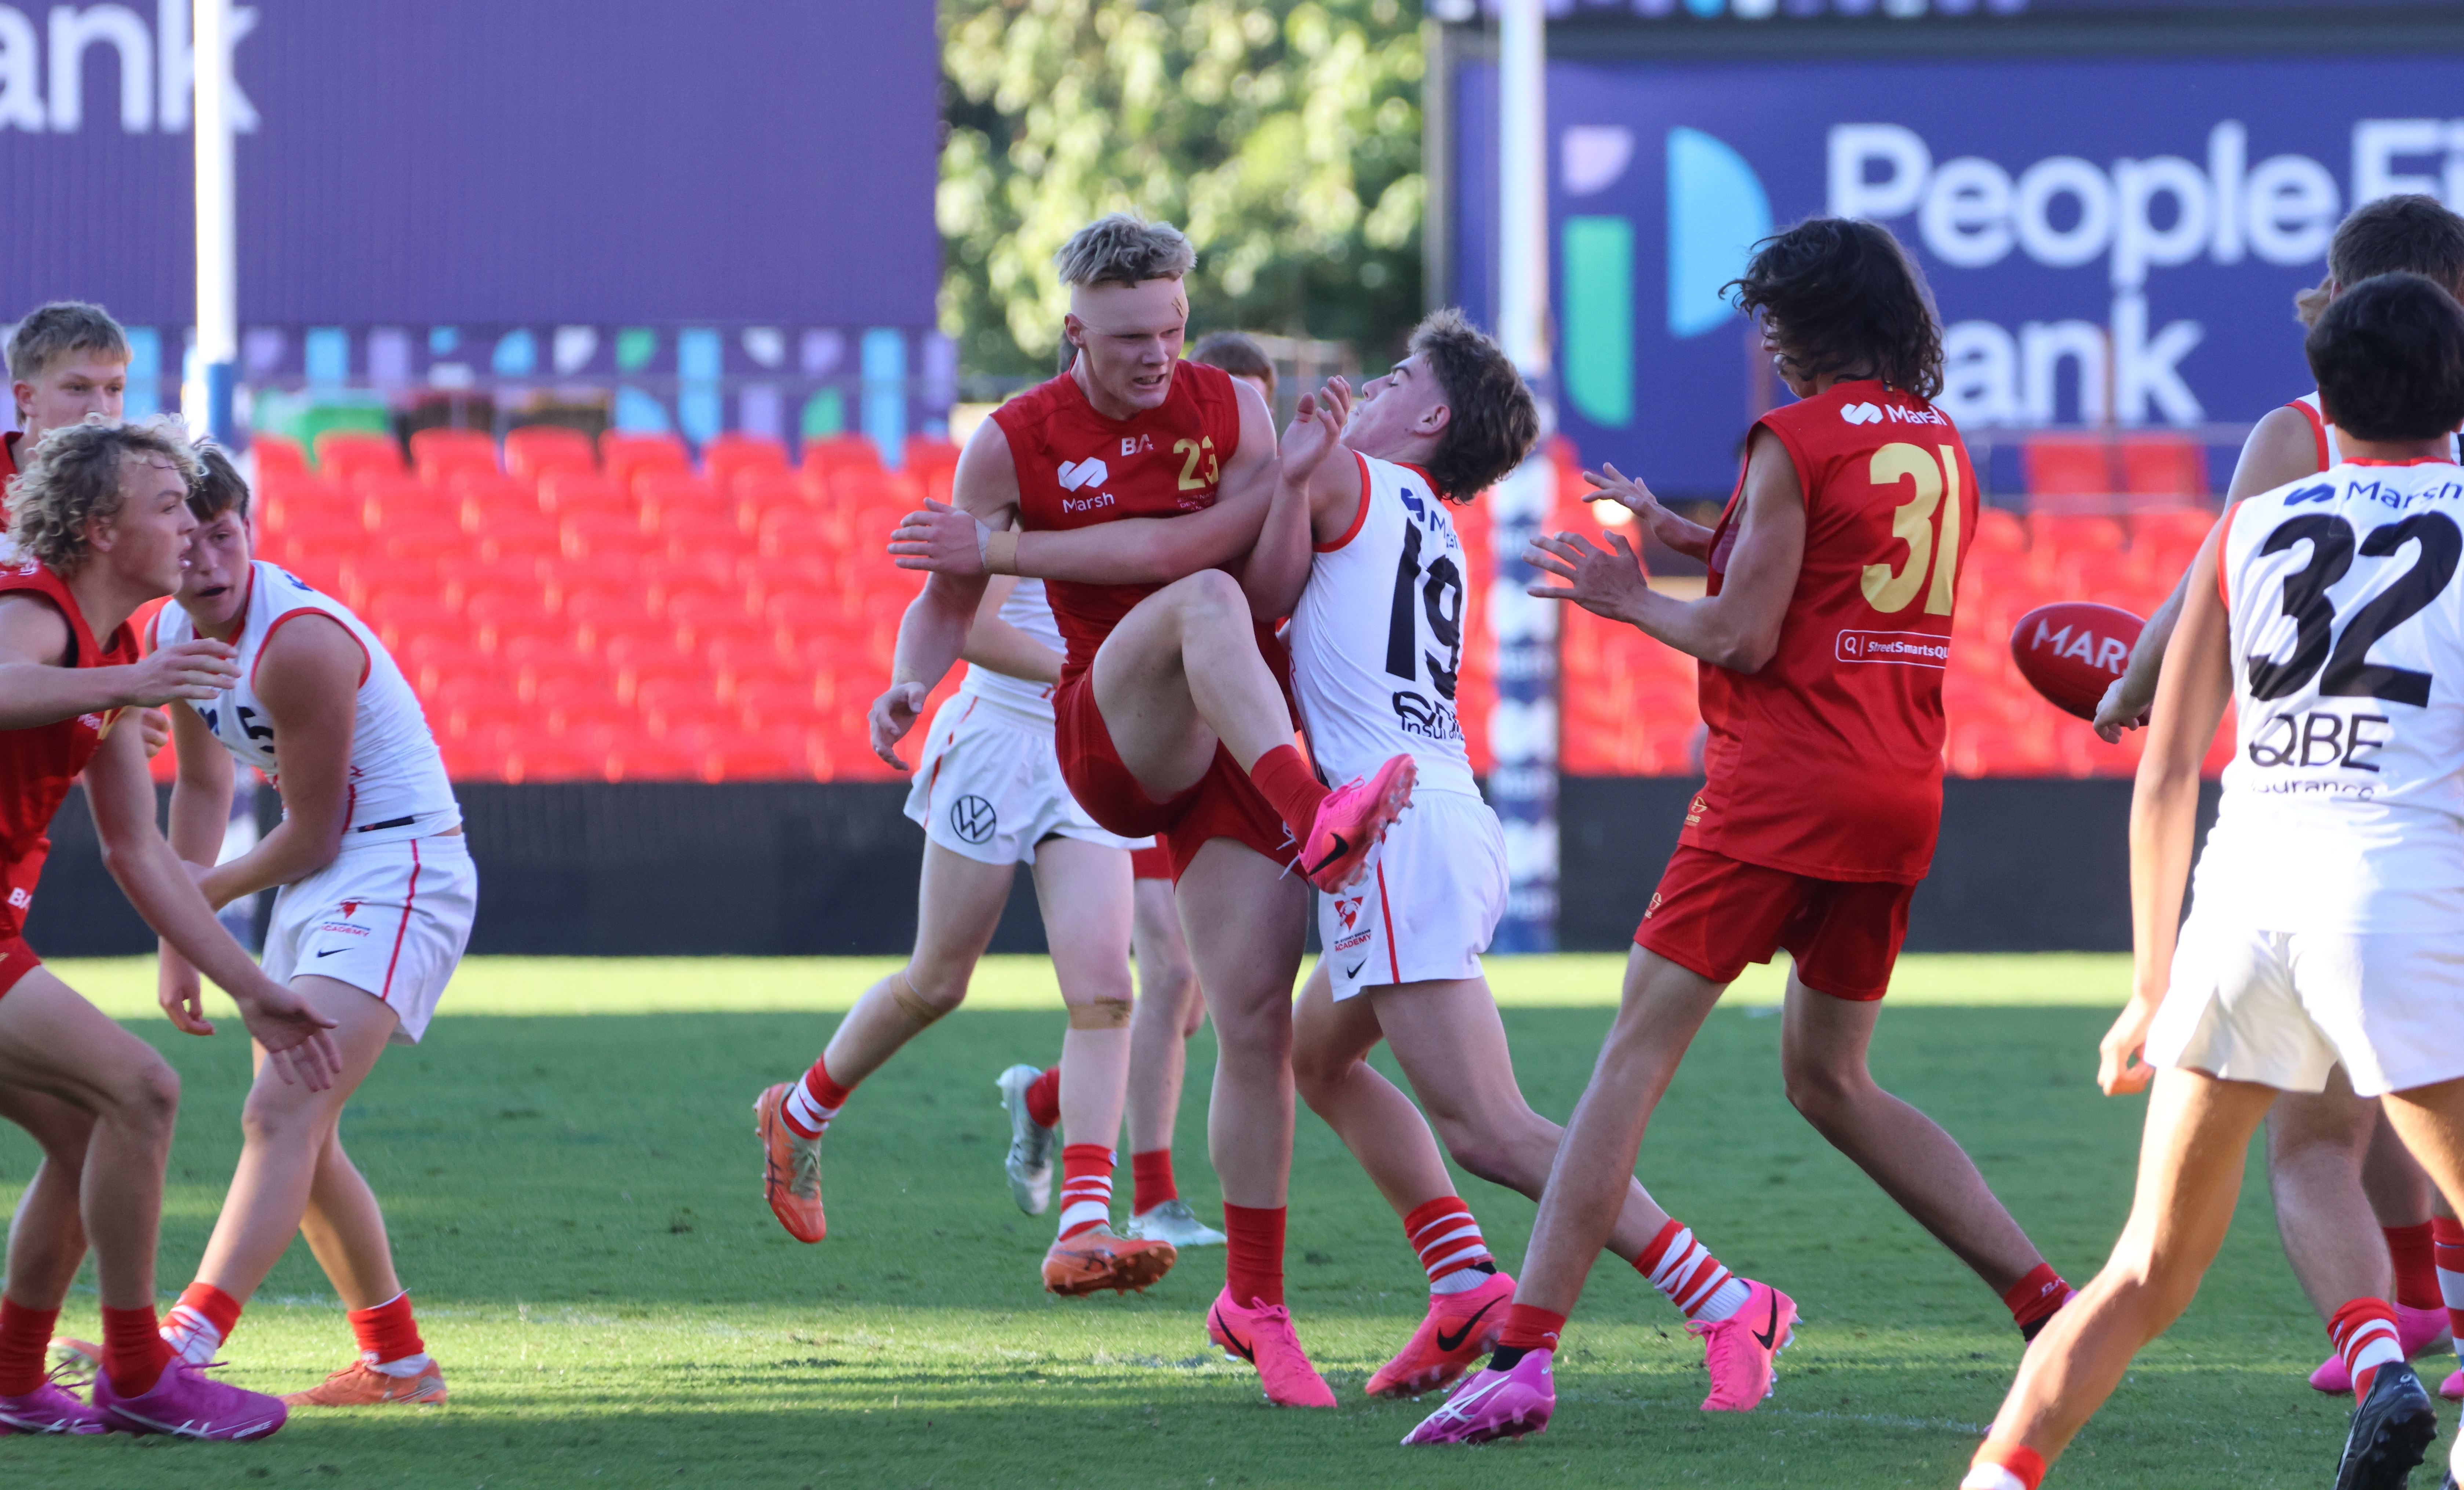
By the Numbers: How the Power started to shut down
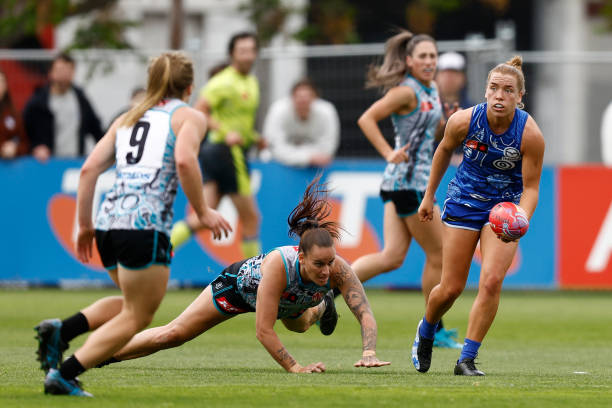
NORTH Melbourne ultimately ran away with a comfortable win over Yartapuulti on Sunday afternoon, but things did not look so straight forward earlier in the match.
Yartapuulti (the Power) matched it with the Kangaroos early in the match, and as such, went into quarter time even with them on the scoreboard at 1.2.8 apiece.
Then, things started to fall apart in the second term for Yartapuulti. North Melbourne kicked three goals to none in the quarter to open the game up in its favour.
So, where did things go wrong for the Power? Rookie Me Central will take a look at the stats in search of an answer.
Clearances
The root of Yartapuulti’s problems started with the clearances, which then affected other areas.
In the first quarter, North Melbourne only led the clearance count by two, but in the second quarter it had four more than Yartapuulti did to lead the overall count by six at half time.
The Kangaroos also led the hit out count in both the first and second quarter, so its rucks were helping the midfielders get first hands on the ball. Those mids, who together are already one of the strongest units in the competition, were getting the ball and moving it forward.
Uncontested Possessions
That strength in the clearance battle also helped North establish dominance in the uncontested possessions.
In the first two quarters, North Melbourne had 49 and 38 uncontested possessions respectively, whereas Yartapuulti only had 18 and 17.
This is in stark contrast to the contested possession battle, which remained relatively even between the two teams between the first and second quarter. The differential between the two teams from the first quarter to the second only grew by three in North’s favour.
Inside 50s
This dominance out of the middle from the Kangaroos helped the home side accelerate their inside 50 count in the second term, while Yartapuulti’s actually went backwards.
In the first quarter North recorded six inside 50s to Yartapuulti’s nine. In the second quarter, that tally was 16 to four in North’s favour.
Although Yartapuulti’s inside 50 efficiency rose significantly from first quarter to second and North Melbourne’s didn’t, such a low inside 50 count was always going to mean kicking much of a score was going to be a tough challenge.
Many areas stayed consistent
Despite the stark contrasts in these stats areas, many of the other differentials stayed pretty consistent. This included number of disposals, tackles and intercept possessions.

AFL Draft trends: Mature-age list balance
IN THE wake of the latest AFL Draft, the time to reflect allows for insights around how each club approaches their intakes. Trends appear and shift all the time, and looking at the post-Covid era (2022 onwards), a few recruiting teams have opted to dip into the mature-age talent pool. It continued in 2025 with […]
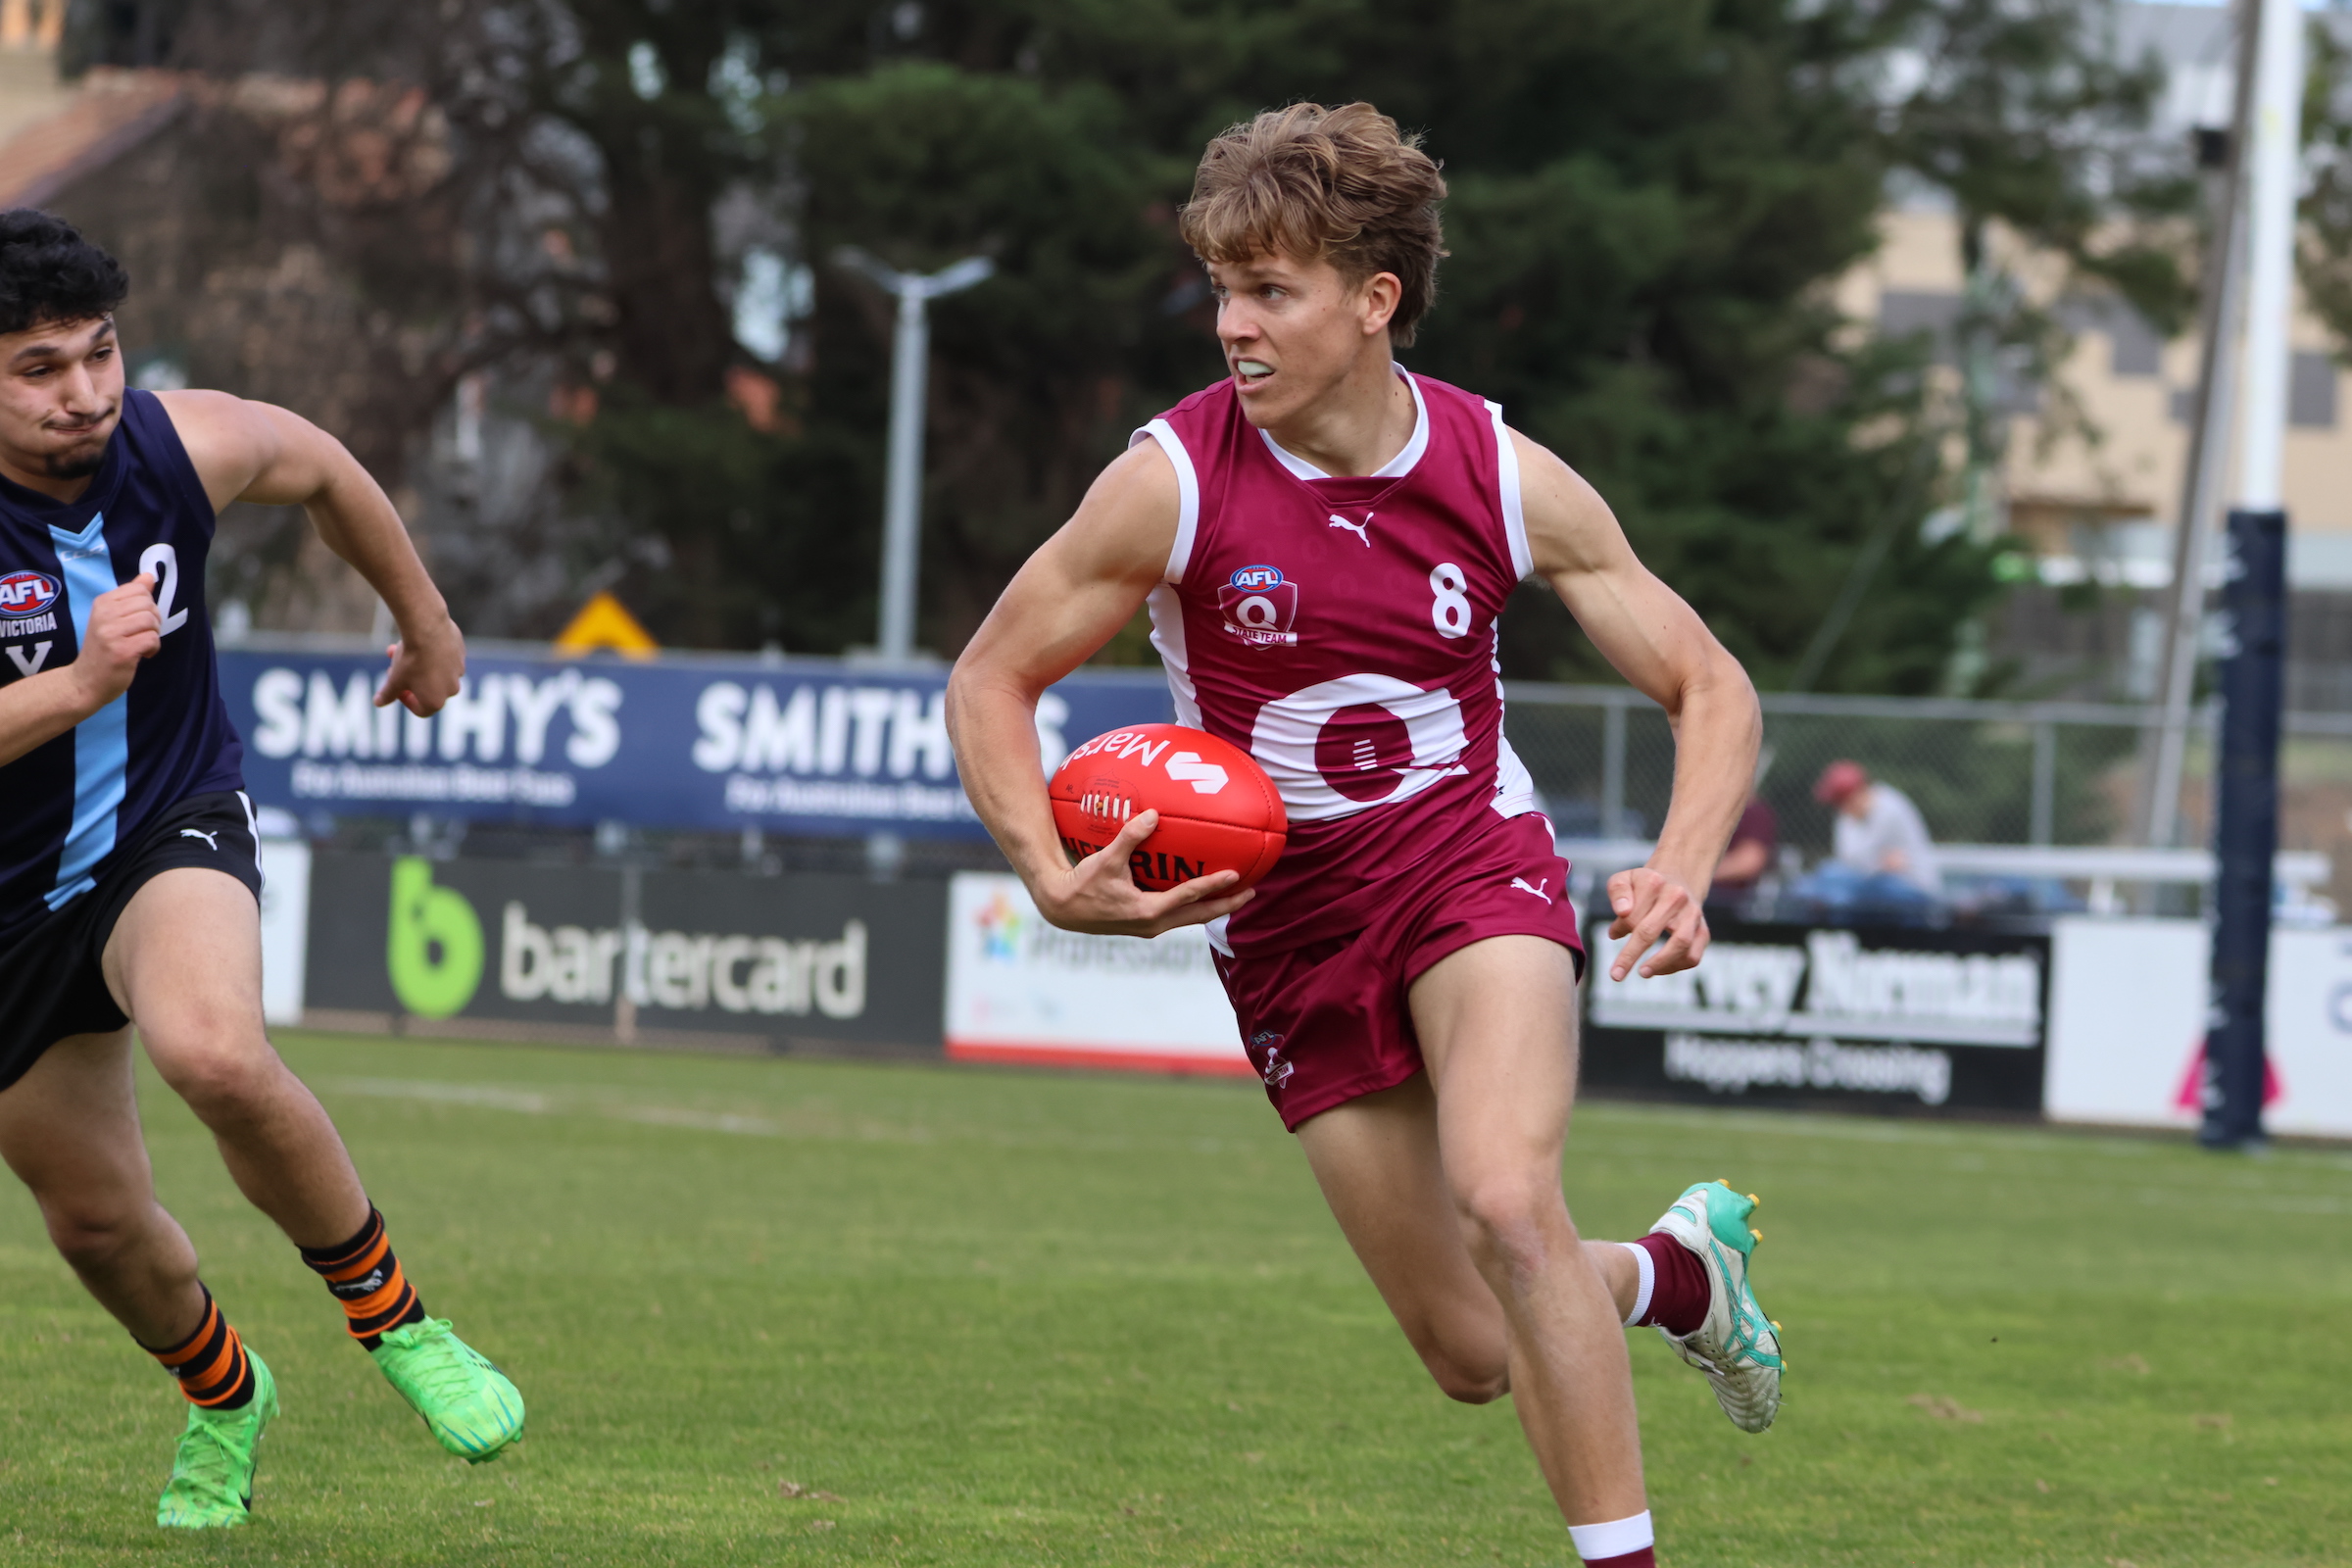
AFL Draft trends: Running power dictates play
THE AFL is an ever-evolving landscape; from how the game is played, to the rules it is played under, and which type of player is thus most effective. After the latest draft intake, one key attribute is becoming increasingly in-vogue across every line – running power. We put it under the microscope in the first […]
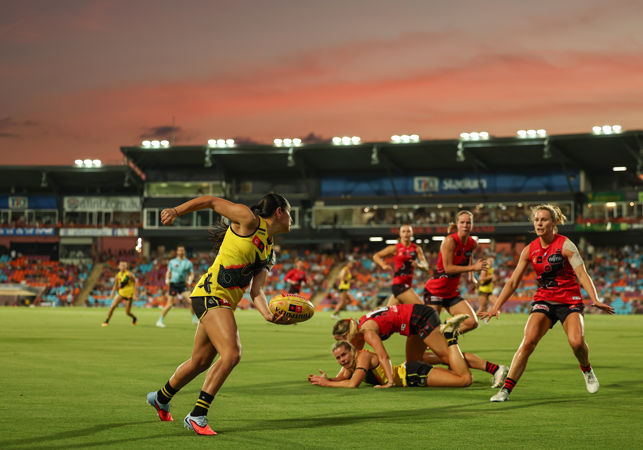
ANALYSIS | Tiger troubles put down to “moments”
IF YOU had done a poll at the start of the season to see which AFL Women’s team would be winless at the halfway mark, very few – if any – would have nominated Richmond. But, that is exactly how the ladder looks for the yellow and black, anchored to the bottom with an 0-6 […]
Revisited: ‘The most compromised draft in history’
THERE was, and continues to be plenty of noise surrounding just how compromised this year’s AFL Draft is shaping up to be. Every second emerging ‘top 25’ talent seems to be tied to a club, and recruiters came into the year matching that notion with around half of the best 50 players being off limits. […]
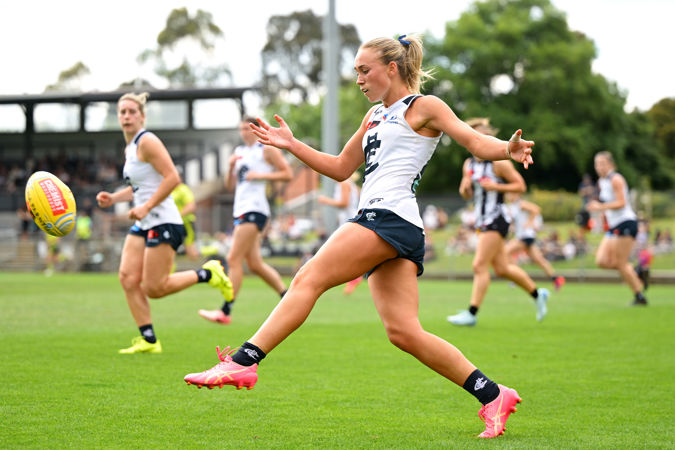
Sherar snaps up maiden BnF after dominant year
WITH the AFL Women’s season coming to a close, clubs are starting to award their club champions, recognising the stars of the season. In this new series from Rookie Me Central, we take a look at the efforts of each best and fairest winner and what led them to have such stellar campaigns. In the […]
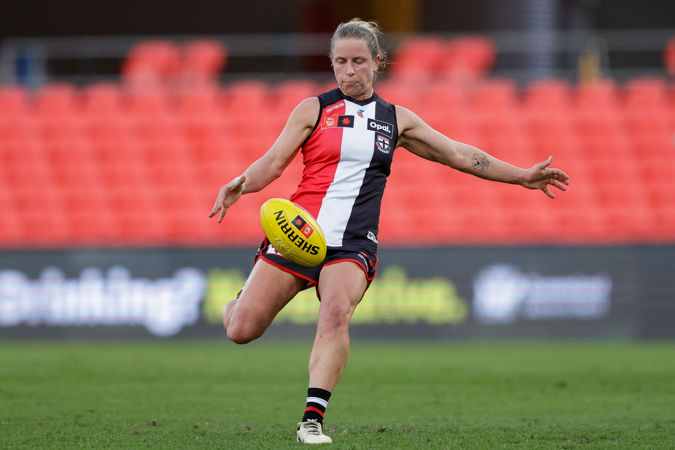
Lambert lands second straight Saints top gong
AS THE AFL Women’s season starts to wind down, clubs are starting to award their club best and fairest awards, recognising the stars of the season. In this new series from Rookie Me Central, we take a look at the seasons of these club champions and what led them to have such stellar seasons. Next […]
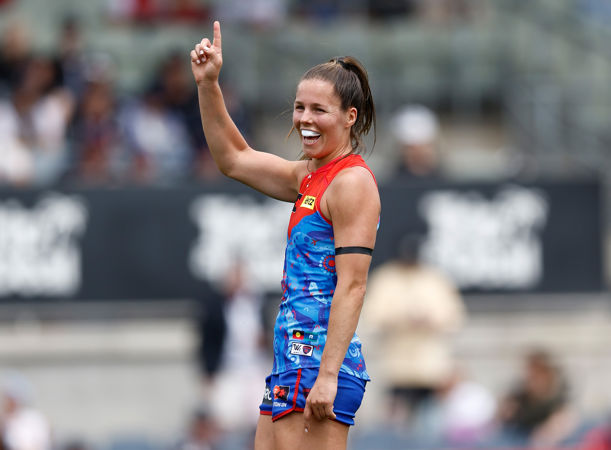
Hore hoists yet another Daisy Pearce Trophy
AS the AFL Women’s season starts to wind down, clubs are starting to award their club best and fairest awards, recognising the stars of the season. In this new series from Rookie Me Central, we take a look at the seasons of these club champions and what led them to have such stellar seasons. Next […]
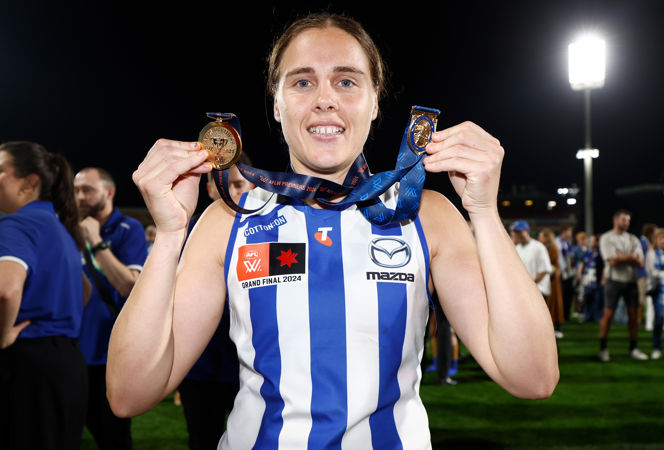
Jasmine Garners yet another Club Champion Award
AS the AFL Women’s season starts to wind down, clubs are starting to award their club best and fairest awards, recognising the stars of the season. In this new series from Rookie Me Central, we take a look at the seasons of these club champions and what led them to have such stellar seasons. Next […]
Mon Conti-nues to reign supreme at Tigerland
WITH the AFL Women’s season coming to a close, clubs are starting to award their club champions, recognising the stars of the season. In this new series from Rookie Me Central, we take a look at the seasons of each best and fairest winner and what led them to have such stellar seasons. In the […]
